
Data-Driven Marketing in the AI Era: How Data Becomes Decisions (and How Results Get Measured)
There’s a moment almost every marketing lead has lived through at least once. You sit down in front of a dashboard packed with numbers, the board is waiting for a recommendation on next quarter’s budget, and you realise that all the stuff on the monitor isn’t telling you what you actually need to know. Not because the data is missing. Because the data you have doesn’t answer the question you were asked.
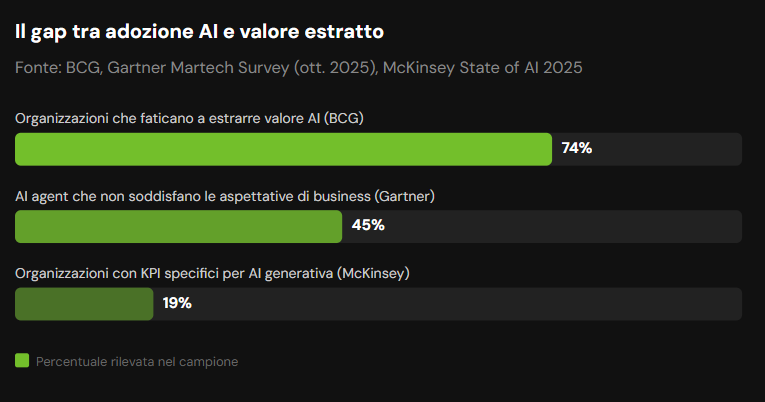
We’re in 2026. Companies have more analytics tools than ever. AI generates reports automatically, optimises campaigns in real time, produces insights about behaviour and segments that ten years ago would have required a team of analysts. And yet BCG finds that 74% of organisations still struggle to produce concrete, scalable value from their AI initiatives. Gartner, in a sample of 413 martech leaders surveyed between June and August 2025, finds that 45% admit their AI agents don’t meet the business expectations that were set. McKinsey calculates that only 19% of organisations track specific KPIs for the generative AI they have already adopted.
These are not numbers about AI. They are numbers about decision-making. AI has made it more comfortable not to think, because there’s always an automated report that appears to answer the question. The problem is that it answers a simplified version of the question, and that simplified version often leads to decisions that don’t change anything important.
What follows is not a guide to tools. It’s a reflection on how you build the connection between data and decision in an era where AI is everywhere, but strategic thinking remains stubbornly human.
The Data That Never Becomes a Decision
In marketing there is an activity that consumes time without producing results: looking at data without knowing what to do with it. It isn’t laziness. It’s the direct consequence of building measurement systems without starting from the decisions those systems are meant to support.
An average marketing team in 2026 has access to GA4, Meta’s ad platform, the CRM, and often a BI tool such as Looker Studio or Tableau. Each of these systems produces metrics. Many of those metrics get looked at every week. Very few actually change the team’s behaviour when they move.
This is the distinction that matters. A useful metric is one that, when it changes, causes something to change. If the email open rate drops and nobody does anything, that isn’t a metric: it’s decoration. If the cost per acquisition on Meta climbs 30% and the budget stays put because “we’re waiting to see if it’s a trend”, that dashboard isn’t driving any decision.
The problem isn’t new. AI has amplified it because it has multiplied the volume of available metrics without changing the quality of the process by which we use them. A marketing lead today receives on average three times as many automated reports as in 2022. Not three times as much clarity.
The starting point isn’t “what data do I have?” but “what decision do I need to make, and what’s the minimum information needed to make it well?”
This reversal sounds trivial written this way. In practice, it requires abandoning years of habits built around the availability of data rather than its decision-making usefulness. It requires asking an uncomfortable question of a series of long-used KPIs: “if this number changed tomorrow, what would we do differently?”
If the answer is “nothing”, that number isn’t a KPI. It’s a number.
What “Data-Driven” Really Means in 2026
“Data-driven” has become a label. It’s used by companies that take decisions based on two lines of a monthly report. It’s used by teams that have never run a serious A/B test. It’s used by anyone who has installed Google Analytics, which in 2026 means basically every company with a website.
The operational definition is much simpler, and much more demanding. An organisation is data-driven when the relevant decisions it takes — budget, positioning, resource allocation — are modified by the data it collects. Not informed. Modified. There’s a substantial difference between the two.
“Informed by data” means data is read before the decision is taken. “Modified by data” means that without that data the decision would have been different. The second case is rare. It’s the case in which investing in analytics is worth it.
In the AI era this distinction has become harder to maintain. Tools produce automated recommendations that look like data-driven decisions. Technically they are. But if nobody on the team understands why that recommendation is being made, what signals it’s based on and what proxy it’s optimising, you’re delegating the decision-making process to a system that doesn’t know the business context. And business context is almost always the most relevant factor.
The McKinsey State of AI 2025 finds that organisations getting real value from AI share a common trait: they have defined explicit processes for establishing when and how to validate model output with human judgement. They don’t blindly trust AI. They use it as input in a process that remains governed by people who understand the boundaries of the business.
Why the Attribution You Use Tells a Partial Story
If there is one thing that data-driven marketing has consistently got wrong over the past fifteen years, it’s attribution. AI has made the situation more complicated, not simpler.
An attribution model tries to answer a precise question: which touchpoint contributed to this conversion, and to what extent? The correct answer would require observing every single interaction a customer had with the brand before buying, weighting each one correctly, and isolating the causal effect of every channel. This is technically impossible in exact form. So all attribution models are approximations. The problem arises when you forget that they are approximations and take significant budget decisions as if they were facts.
Last-click, still the default model in many systems, assigns the entire credit to the last touchpoint before conversion. It’s easy to implement and systematically misleading: it ignores everything that built the purchase intent. First-click makes the opposite mistake. Linear models distribute credit evenly across all touchpoints — honest about admitting uncertainty but useless for optimising anything.
GA4 offers a data-driven model that estimates the probability of conversion for each touchpoint, but it requires significant data volumes and, above all, complete data. And this is where the problem gets worse in 2026. Somewhere between 20% and 40% of real conversions don’t make it into traditional tracking systems, due to ad blockers, Safari’s ITP and sub-optimal configurations. A data-driven model built on incomplete data doesn’t produce more accurate insights. It produces more sophisticated errors.
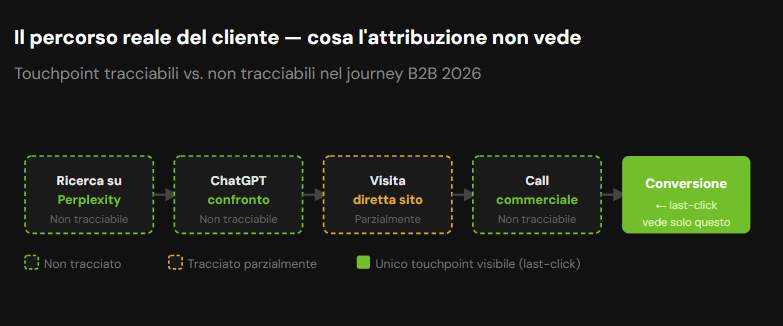
On top of this comes the problem of the purchase journey in the AI era. Someone evaluating a B2B purchase in 2026 may have read three articles on Perplexity, asked ChatGPT to compare suppliers, visited the website directly without coming through any traceable source, then converted after a sales call. The attribution system will see the last click, or at best the last session. It won’t see anything of what built that purchase decision.
The most reliable approach in 2026 combines statistical attribution for tactical decisions with incrementality tests for strategic budget decisions. It isn’t the easiest. It’s the one that answers the questions that really matter.
An incrementality test, in short, measures how many additional conversions were generated thanks to a specific campaign, compared with what would have happened without it. It’s run by suspending or scaling back the campaign on a control segment and comparing the results. It isn’t fast, it isn’t trivially automatable, and it produces results that often contradict consolidated narratives about the channels that “work”. For this reason, very few teams do it regularly. For this reason, it is almost always worth doing.
AI Hasn’t Solved Decision-Making. It Has Made It More Comfortable
Every great technological promise of the past twenty years has included a variation on the same statement: “with this tool, you’ll make better decisions faster.” CRMs said it in the early 2000s. Marketing automation platforms said it in 2010. CDPs still say it today. Generative AI in marketing is no exception.
In part, the promise holds up. AI analyses signals that a human analyst can’t process in real time, optimises ad bids at a granularity that would be impossible to manage manually, identifies non-obvious behavioural segments in navigation data. These are not marginal capabilities.
The problem is the logical leap many teams take: from AI that optimises campaigns, to AI that drives strategy. The first case works because the problem is well-defined, the feedback data is immediate and the optimisation metric is clear. The second case is much harder, because strategic decisions require context, judgement on competing priorities, and the ability to distinguish a real signal from short-term noise.
The Gartner Martech Survey of October 2025 is explicit on this. 89% of martech leaders expected significant benefits from the AI agents they adopted. 45% admit those expectations were not met. The main cause cited isn’t algorithm quality: it’s gaps in the data infrastructure and the lack of clear processes for integrating AI output into human decisions.
In other words: AI doesn’t work if you don’t already know, before adopting it, what questions it needs to answer and how those answers will feed into the team’s decision-making process. This is the work that almost always gets skipped, because it’s less visible than implementing the tool, requires more uncomfortable internal conversations, and produces no shiny demo to show the board.
The practical outcome is what the data confirms: adoption close to saturation, value extracted still concentrated in a minority of organisations. Not because the others chose the wrong tools. Because no one had updated the decision-making process before buying the tool.
From Data to Decision: the Method
The framework that follows comes from observing where the process breaks in the organisations we work with. It almost always breaks at the same point: the data-collection system is built first, and only afterwards does anyone try to figure out what to do with it.
The correct sequence is the opposite.
First: map decisions, not metrics. Start with the list of relevant decisions the marketing team makes on a regular basis. Which channels to activate or shut down. How to reallocate budget across campaigns. What content to produce. Which segments to focus commercial resources on. For each of these decisions, one question: on what basis are you making it today? Intuition, habit, or verifiable data?
Second: for each decision, define the minimum necessary metric. Not the ideal one: the minimum. What is the piece of information that, if you had it, would actually change your decision? This question is harder than it looks, because the honest answer almost always reveals that a good chunk of the metrics that are routinely monitored wouldn’t make it into the answer.
Third: audit the quality of the data that feeds those metrics. This is the point at which the work on data infrastructure becomes non-negotiable. If the metric you need in order to decide is based on incomplete data or unreliable attribution models, cleaning up the infrastructure precedes everything else. You don’t build a solid decision-making process on shaky foundations.
Fourth: set the review frequency by type of decision. This step almost always gets skipped. Operational decisions require real-time data and frequent review. Tactical decisions require data aggregated over longer periods. Strategic decisions require trends and year-over-year comparisons. Using the same cadence for every level leads to two errors that compound: you react to short-term noise on strategic decisions and you miss important trends on operational ones.
The Decision Cycle in the Real Working Week
A data-driven decision cycle is not a monthly dashboard-review exercise. It’s a structure that defines who looks at what, with what frequency, and what actions follow. Without this structure, reviewing the data is a reporting activity, not a decision-making one.
In organisations that work well on this, there are three separate levels — deliberately kept separate.
Operational level. Run by whoever executes the campaigns, with weekly reviews on immediate performance metrics: CPC, CTR, landing-page conversion rate, quality score. Decisions at this level are fast and reversible: increasing a budget, pausing an ad group, testing a creative alternative. None of these calls require management approval.
Tactical level. Run by the channel lead or the marketing manager, with monthly reviews on aggregate efficiency metrics: per-channel contribution, cost of acquisition by segment, volume and quality of leads generated. Decisions at this level are less frequent and produce effects on a 60-90 day horizon: shifting budget between channels, changing content priority, renegotiating with vendors.
Strategic level. Run by the CMO or by senior management, with quarterly reviews on business metrics: revenue attributable to marketing, LTV of customers acquired by channel, AI Share of Voice in generative engines, NPS and brand awareness in the target segment. Decisions at this level define the plan for the next six to twelve months.
The issue that comes up most often is that the third level is discussed with first-level data. Campaign metrics get carried into the boardroom because they are the only ones readily available and understandable to everyone. You end up debating the CTR of an ad when the real question is whether brand positioning is working. It isn’t a tools problem. It’s a discipline problem about which data belongs to which conversation.
Decision framework: type of decision, metric, source and cadence
| Type of decision | Reliable metric | Data source | Frequency |
|---|---|---|---|
| Paid campaign optimisation | Actual CPA, ROAS by ad group | Ad platform + server-side conversions | Weekly |
| Budget allocation across channels | Incremental contribution by channel | Incrementality tests + GA4 data-driven | Monthly |
| Editorial content priorities | AI citations, qualified traffic, organic leads | Search Console + GEO monitoring tools | Monthly |
| Positioning and key messages | AI Share of Voice, brand sentiment in LLMs | Generative monitoring (Perplexity, ChatGPT) | Quarterly |
| Investment in new channels | CAC by channel, LTV by acquisition cohort | CRM + retention data | Quarterly |
| Annual budget strategy | Attributable revenue, marketing contribution margin | ERP / finance + integrated CRM | Annual + semi-annual review |
Frequently Asked Questions
What does data-driven marketing mean in the AI era?
Data-driven marketing means taking decisions based on verifiable data rather than on intuition or entrenched habits. In the AI era the concept has become more complicated: tools automatically produce insights, reports and recommendations, but this doesn’t amount to better decisions. A genuinely data-driven approach requires first defining which decisions matter, and then building the measurement system that feeds them — not the other way around.
Why doesn’t AI automatically solve the marketing decision problem?
AI automates report production and optimises campaigns in real time, but it doesn’t change the process by which a team decides what to do. The McKinsey State of AI 2025 shows that only a small share of organisations extract measurable value from AI. The main reason is that tools get added on top of unchanged decision-making processes, fed by the very attribution models that weren’t working before.
Which KPIs should I use to measure marketing in the AI era?
KPIs depend on the decisions you need to take, not on habit. For budget decisions: incremental contribution by channel, not last-click ROAS. For content and visibility decisions: citations in generative engines (AI Share of Voice), not just organic traffic. For retention decisions: LTV and repeat-purchase rate, not just CAC. The operational criterion is simple: a KPI is useful if, when it changes, something changes in the team’s behaviour.
How does marketing attribution work in the AI context?
Attribution tries to work out which touchpoint contributed to a conversion. Classic models assign credit arbitrarily and ignore most of the real customer journey, which today runs through ChatGPT, Perplexity, voice searches and untrackable channels. GA4’s data-driven models improve the picture but require complete data to work.
The most reliable approach in 2026 combines statistical attribution with incrementality tests for strategic decisions.
What are incrementality tests and why do they matter?
An incrementality test measures the causal effect of a marketing activity: how many additional conversions were generated thanks to that specific campaign, compared with what would have happened without it. It’s run by pausing or reducing a campaign on a control segment and comparing the results. It’s the most honest tool for answering the question attribution models can’t: is this spend actually generating incremental sales?
How often should a data-driven marketing plan be reviewed?
It depends on the type of decision. Operational decisions should be reviewed every week with real-time data. Tactical decisions every 4-6 weeks with aggregate data. Strategic decisions every quarter with long-term trend data. Lumping every review onto the same cadence almost always leads to reacting to short-term noise on the wrong decisions.
Which marketing metrics should you stop using?
Not the ones that look unflattering, but the ones that don’t change any decision when they move. In practice: total organic traffic without distinguishing intent and quality, last-click ROAS on campaigns assisted by other channels, the number of raw leads without qualification, sessions as a proxy for engagement. Better to have a handful of metrics that drive concrete actions than a long list that ends up in a report no one updates.
How do you build a data-driven culture in a marketing team?
The starting point isn’t tool training. It’s agreeing on which questions the team needs to be able to answer every week, every month, every quarter. Once the questions are set, you identify the data needed to answer them and check whether it exists, is reliable and is accessible. A data-driven culture isn’t built by installing GA4 or buying Tableau. It’s built by getting the team into the habit of tying every metric to a possible decision.
More articles in Market Insights

Angle, not topic
AI SEO Angle, not topic Why your content feeds your competitors in the era of LLMs 65% of B2B content is never consumed by buyers. A figure that has been circulating for...
Read
From Business Goal to AI-Driven Project: The Method for Building Digital Strategies with Real KPIs
L’88% delle aziende dichiara di usare l’AI, ma solo il 5% ne ricava valore reale a scala. L’ho letta per la prima volta nel McKinsey Global Survey di novembre 2025, 1.993 rispondenti in 105 paesi, e ho pensato: questo è il numero che rende inutili tutti gli altri. Non perché sia sorprendente. Perché spiega perché quasi nessuno sa rispondere alla domanda più semplice del mondo: “e tu, quanto stai guadagnando dall’AI?” Mentre accade questo, la search si sta riorganizzando attorno a una nuova architettura. ChatGPT ha 900 milioni di utenti attivi settimanali. Gemini ha superato i 750 milioni. Il 70,6% del traffico che arriva da questi motori generativi è invisibile a Google Analytics, classificato come “Direct”, quindi ignorato nella maggior parte delle decisioni strategiche (Loamly, “State of AI Traffic 2026”, 446.405 visite analizzate). Quel traffico, però, converte quattro volte meglio del traffico organico tradizionale.
Read
From SEO to GEO: How LLMs Are Rewriting the Rules of Brand Visibility
From SEO to GEO: How LLMs Are Rewriting the Rules of Brand Visibility Why the SERP Is No Longer Enough — and What Really Changes in the Era of Answer Engines Do...
Read